

Seasons, Cycles, Prices, and Behaviors
The other day I was asked if I thought we were going to have a recession. I answered that at some point we will have a recession, but that no one knows precisely when it will be. I was then asked, “what is a recession?” I answered that a recession is a decline in economic growth, a rule of thumb being two consecutive quarters of negative GDP growth. For a long time, recessions had been defined this way. However, the National Bureau of Economic Research (NBER), which officially declares recessions, now defines a recession as “a significant decline in economic activity spread across the economy, lasting more than a few months, normally visible in real GDP, real income, employment, industrial production, and wholesale-retail sales.”
Here's the thing – since recessions (and bear markets) don’t happen all that often, we tend to forget what led to them, how we felt, and how long they lasted. For shorter frequency periods, we are very familiar. For example, we are familiar with our routines during the typical workweek and on the weekends. We are familiar with the four seasons – spring, summer, fall, winter. But things of a less frequent nature – business cycles, asset bubbles, recessions, presidential cycles, wars, or pandemics – we don’t remember them or perhaps we never experienced them.
George Santayana once wrote “Those who cannot remember the past are condemned to repeat it.1” Mark Twain is attributed as saying, “History doesn’t repeat itself, but it often rhymes.” Taking these both together gives us a good framework of the importance of viewing present events through the lens of history. Here are a few things we should try to remember always when investing:
- Just like the meteorological seasons, there are business and economic seasons. These include earnings seasons for each of the four calendar quarters. We can also see that the S&P 500 has, on average2, performed best from October through January (average return of 4.02%) and performed the worst from February through May (average return of 1.61%). That doesn’t mean things always will play out like this, but there is some seasonality. Economic indicators are frequently adjusted for seasonality. We are all familiar with the day after Black Friday. It’s the biggest shopping day, but also the day that drives sales and helps some retailers push their profits into the “black.” We are currently in a mid-term election year that has contributed to the volatility. Regardless of the outcome, we will get through this season.
- There are cycles. Business cycles can be measured from boom to bust or peak to trough, including recessions as well as bull and bear markets. Often the bull markets coincide with asset bubbles. These could be in real estate, stocks, or bonds. There are political cycles, demographic and generational cycles, and technological cycles. Authors William Strauss and Neil Howe postulate of 80 to 90-year cycles or saecula that have different seasons or moods within them that lead to different “turnings.”3 There are secular bull and bear markets that can last for 15 to 20 years and there are cyclical bull and bear markets that approximate the business cycle. We are currently coming out of a monetary cycle where rates were near zero and now the Fed is tightening again. We have been through inflationary cycles before and the cycle we are going through now has some similarities with the last cycle. Inflation will come down and we will get through this cycle.
- Asset prices can behave rhythmically. They may appear erratic or random when viewed up close, but often there may be a pattern that coincides with the current season or the cycle. Prices generally follow one of two schematics – momentum or mean reversion. Momentum means that if something is moving in one direction, it will keep moving in the same direction. If something is performing very well, it will keep performing well until it doesn’t. Mean reversion would suggest that if something is too high, it needs to come down or if it is too low, it needs to move higher. Mean reversion is like a rubber band – it will push against the direction that you’re pulling it from. If volatility is extremely high, it can be expected to come down over time. Momentum and mean reversion will continue to happen as the seasons and cycles change.
Tying the seasons, cycles, and price behaviors together, we have gone through a period of high momentum from the depths of the pandemic to a period where prices are reverting back to the mean. In the absence of momentum, we will always have mean reversion. From March 12, 2020 through January 13, 2021, Pelaton (PTON) was up more than 750%. This was incredible momentum during a season where everyone was staying at home during the pandemic and going to the gym was not an option. Fast forward to today, during a period of high inflation, a higher cost of borrowing, and mean-reverting asset prices, this stock is now down more than 94%, lower than it was prior to the pandemic.
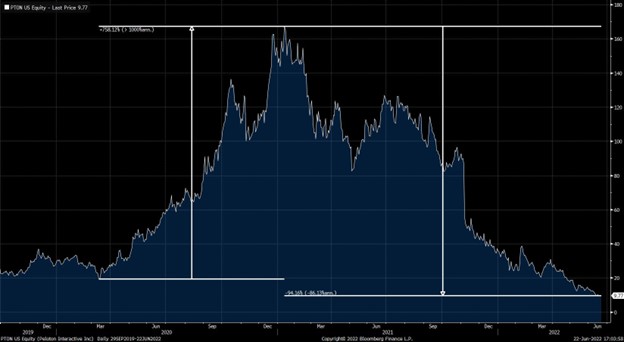
But, one may ask, if markets are so efficient, why did prices get so spectacularly high for this stock only to come crashing down less than 18 months later? Stocks, by themselves, are not always efficiently priced, just as investors aren’t always rational. PTON is an excellent case of this, being already overvalued but with investors adding fuel to the fire, getting caught up in the hype of the momentum. The faster it went up, the more people noticed. Instead of there being a fear of losing capital, there was a fear of missing out (FOMO). This could have been said of several stocks, crypto-assets, and SPACs. Everything was in bloom in the season. The markets at the time appeared to have only one direction, up. But nobody wanted just the normal bloom, they wanted the biggest and the best in bloom. The mood of investors seemed to correlate with the momentum of the markets. While we often refer to the “stock market,” it is really a market of stocks. If one builds a portfolio based only on stocks with high momentum, the chances are high that these stocks will move up together and then later, when momentum crashes, will come down together. Momentum crashing is often when the ignored, the boring, or the forgotten stocks start performing well, a new season for a different type of a company. They may have been undervalued for too long and now they are reverting back to the mean. But here’s the thing, stocks almost never move right back to the mean and stop. They almost always move past it. On the way up and on the way down. This is why some of the best buying opportunities are when the markets are performing very poorly. Stocks can quickly go from overvalued to fairly valued to undervalued, all in dramatic timing and while the fundamentals haven’t changed significantly. The principles of mean reversion and momentum are a part of this, but it is also due to our emotions. As human beings, we go through cycles, too:
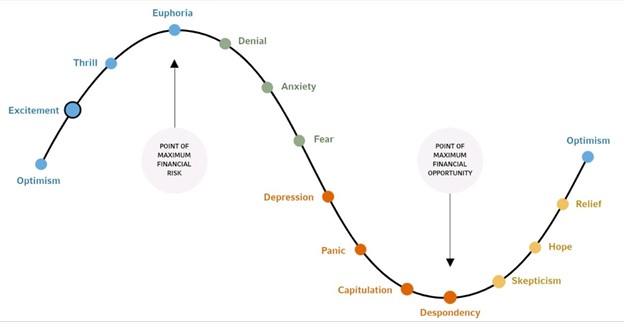
We can feel optimistic, excited, and even euphoric. These feelings can change to anxiety to fear and then panic. In my opinion, this is one reason why markets are as volatile as they are. We’re all human. We have feelings. We get both greedy and fearful at times, pushing stocks higher than they need to go and lower than they need to go. If computers were buying and selling stocks for everyone, it would probably be very orderly with prices not detaching from value so often. This is one major reason why having a financial advisor is so important. They can help us stay grounded when things look too enticing, and they can help us stay invested when it feels like the sky is falling.

References:
- Volume I of Reason in Common Sense
- https://stocktradersalmanac.com/Tools/Data/MonthlyDatabank.aspx
- The Fourth Turning, William Strauss and Neil Howe
Jim Worden offers investment advice through WCG Wealth Advisors, LLC a Registered Investment Advisor doing business as The Wealth Consulting Group. Jim is not affiliated with LPL Financial.
The opinions voiced in this material are for general information only and are not intended to provide specific advice or recommendations for any individual.
All performance referenced is historical and is no guarantee for future results. All indices are unmanaged and may not be invested into directly.